How to Calculate ROI for Nursery Automation Equipment
Nursery automation ROI should be calculated from the nursery’s own labor records, annual production volume and usable machine time. A supplier’s hourly capacity figure is useful for technical screening, but it is not enough to justify an investment.
For a first-pass decision, calculate the total installed investment, estimate the annual net cash benefit, and then calculate simple payback and annual ROI. Before final approval, build a multi-year cash-flow model that includes financing, taxes, residual value and the time value of money.
This method can be used to compare an automatic precision seeder, a seedling grafting robot, a grading or replenishment system, an automatic transplanting machine, or a connected nursery line.
The Four Numbers Needed for a First-Pass Decision
The calculation starts with four numbers.
| Measure | Formula | What it tells you |
|---|---|---|
| Total installed investment | Equipment + freight + duties + installation + utilities + integration + training + commissioning | The cash required to put the equipment into production |
| Annual net benefit | Annual measurable benefits – annual additional operating costs | The yearly cash improvement created by the investment |
| Simple payback period | Total installed investment / annual net benefit | Approximate number of years required to recover the investment |
| Simple annual ROI | Annual net benefit / total installed investment x 100 | Annual return as a percentage of the initial investment |
Simple payback is useful for screening projects. It does not account for the timing of cash flows after the payback date. For a major investment, the finance team should also calculate net present value (NPV), internal rate of return (IRR) and cash requirements during ramp-up.
Iowa State University Extension separates machinery costs into ownership costs and operating costs. It also recommends using capital budgeting for investments that generate cash flows over several years. Those principles apply directly to nursery automation, even though the equipment and production units are different. See its guidance on estimating machinery costs and capital budgeting basics.
Step 1: Measure the Current Manual Process
Do not begin with the quotation. Begin with the process that the equipment is expected to replace or improve.
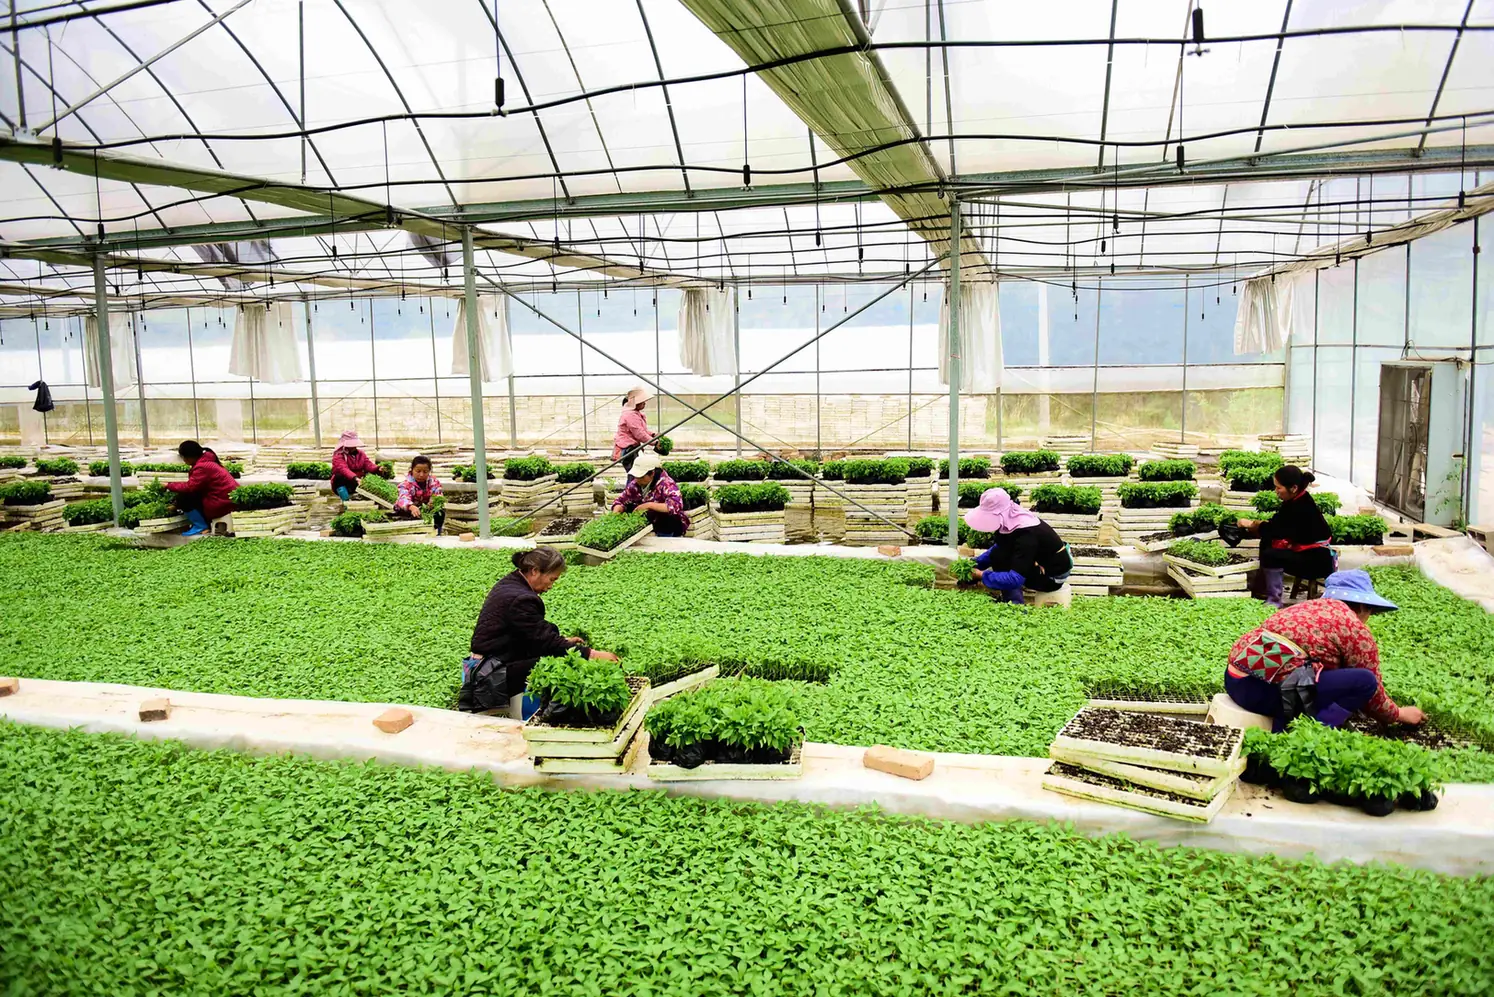
Measure the current operation for several normal production days and at least one peak period. Record:
- operators assigned to the task;
- paid hours per shift, including setup and cleanup;
- trays or acceptable seedlings completed per hour;
- overtime and temporary labor;
- time spent on inspection, correction and rework;
- rejected or damaged seedlings;
- waiting time caused by missing trays, seedlings or downstream space;
- supervisors or technicians supporting the station;
- production that is outsourced because internal capacity is insufficient.
Use the fully loaded labor cost, not only the hourly wage. Depending on the nursery and country, loaded cost may include employer taxes, benefits, recruitment, accommodation, transport, protective equipment, supervision and seasonal-worker training. The exact treatment should follow the company’s accounting policy.
Measure acceptable output, not movement
A manual team may move many seedlings while producing fewer trays that pass the nursery’s quality requirement. Measure the output that is ready for the next stage, not every mechanical movement.
For grafting, that may mean grafted seedlings that meet the nursery’s immediate workmanship standard and enter healing. For replenishment, it may mean corrected trays that pass inspection. For transplanting, it may mean destination trays completed without unacceptable gaps or plug damage.
Step 2: Calculate the Total Installed Investment
The equipment price is only one line in the investment.
| One-time cost | Questions to ask |
|---|---|
| Main equipment | Which model and configuration are included? |
| Feeding and discharge equipment | Are conveyors, tray buffers or collection stations required? |
| Tooling and change parts | Are different nozzles, grippers, clips or tray guides needed? |
| Freight and insurance | What is included in the commercial term? |
| Import duties and local taxes | What applies in the destination country? |
| Site preparation | Are floor, drainage, guarding or clean-air changes required? |
| Utilities | Is additional electrical supply, compressed air, water or network access needed? |
| Installation and commissioning | Who performs the work, and what travel costs are included? |
| Training | How many operators and technicians need training? |
| Integration | Will the machine exchange trays or signals with existing equipment? |
| Initial spare parts and consumables | What should be held on site before the production season? |
| Ramp-up cost | How much labor and test material will be used before normal production? |
For imported equipment, freight, duties, local installation and service travel can materially change the installed cost. Keep those items separate so management can see which costs belong to the machine and which belong to the project location.
Step 3: Replace Rated Capacity with Effective Output
Rated capacity describes a machine under defined operating conditions. ROI depends on how many acceptable seedlings or trays the nursery can produce over a real shift and a real year.
Effective annual output = rated hourly capacity x scheduled productive hours x utilization factor x acceptable-output factor
Scheduled productive hours
Remove breaks, planned cleaning, crop changeovers, blade or tooling changes, preventive maintenance and periods when the machine is not scheduled to run.
Utilization factor
Account for stops caused by tray supply, seedling preparation, operator loading, minor faults, adjustments and downstream congestion. Do not choose the factor from a sales brochure. Measure it during a trial or use a conservative range in the business case.
Acceptable-output factor
Count output that meets the nursery’s agreed quality rule. The rule must be written before the trial. Otherwise, manual and automated results cannot be compared on the same basis.
The relationship between capacity and workflow is visible across the market. TTA-ISO equipment pages commonly present operator count together with hourly capacity, while Urbinati describes tray handling and connected line components around the main machine. This reflects a practical point: the machine cannot produce continuously if feeding, collection or downstream handling cannot keep pace. See the TTA-ISO equipment overview and Urbinati automatic tray lines.
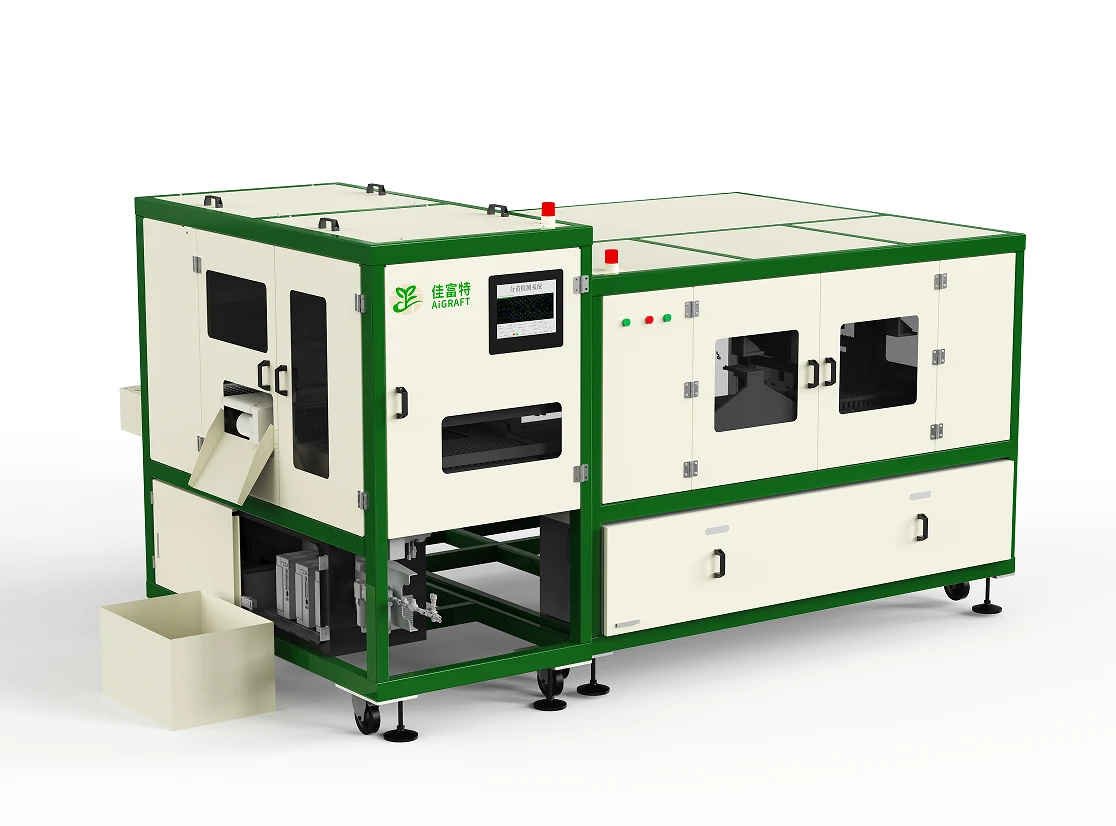
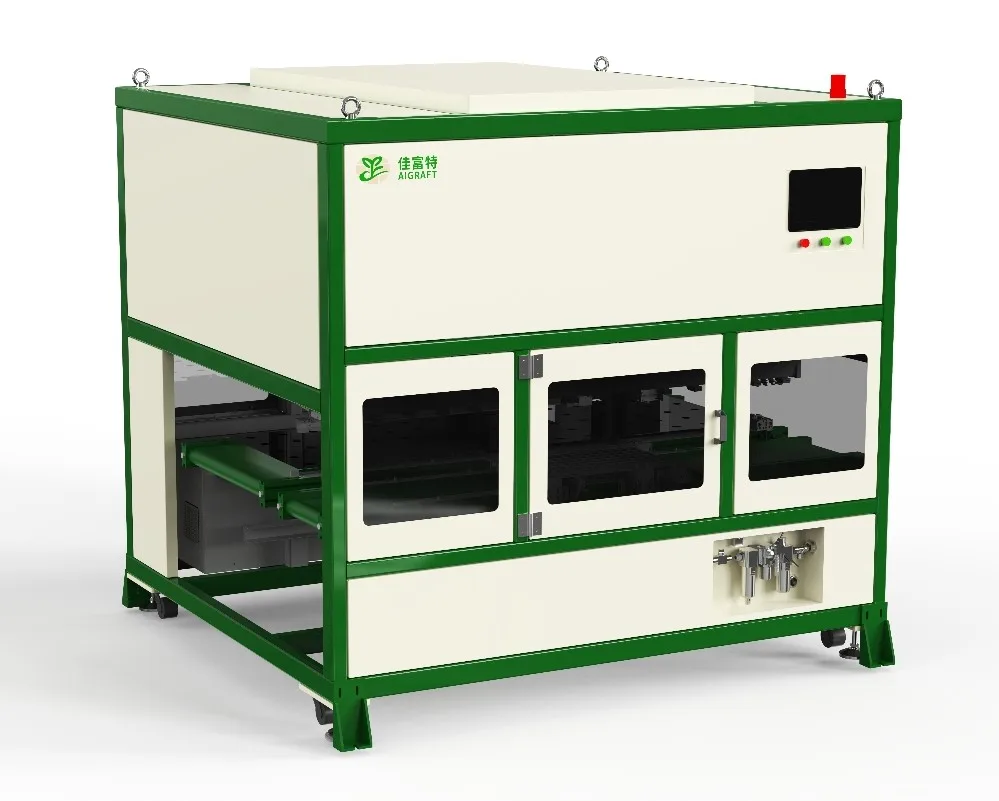
AiGRAFT’s integrated production lines are likewise configured around machine quantity, operators, material flow and nursery layout rather than a single nameplate number.
Step 4: Calculate Annual Benefits Without Double Counting
Avoided direct labor
Annual avoided labor cost = (baseline labor hours – automated labor hours) x loaded labor cost per hour
Do not assume an automatic machine requires no people. UMass Extension notes that automated greenhouse transplanting still requires labor for tasks such as supplying plug trays and removing completed flats, with requirements varying by machine and layout. See the UMass greenhouse transplanting guidance.
Reassigned labor
If employees remain on payroll and move to another task, the full wage is not automatically a cash saving. The value may still be real, but it should be described correctly. It might appear as avoided recruitment, less overtime, reduced outsourcing, more production in another department or lower opportunity cost during a seasonal labor shortage.
Avoided overtime, temporary labor and rework
These items are often easier to verify than broad labor-reduction claims. Use payroll, agency invoices and production records from the same seasonal period.
Additional contribution margin
Extra capacity should be counted only when the nursery has demand for the additional saleable output.
Annual capacity benefit = additional saleable units x contribution margin per unit
Use contribution margin, not sales revenue. Subtract the variable cost of seed, substrate, trays, clips, utilities, packing and other inputs required to produce and sell the additional units. If demand is uncertain, show the capacity benefit as a separate scenario rather than including it in the base case.
Avoided losses and quality costs
Reduced rework, fewer discarded trays or more consistent batches may have financial value, but only count improvements supported by baseline and trial data. Do not count the same improvement once as labor saving and again as quality saving.
Step 5: Subtract Annual Operating Costs
Automation replaces some costs and creates others. Include:
- operators who remain at the machine;
- supervision and technical support;
- electricity and compressed air;
- blades, clips, nozzles, filters or other consumables;
- preventive maintenance;
- repair parts and service travel;
- software or connectivity fees, when applicable;
- cleaning and sanitation time;
- training for new operators;
- scheduled downtime and expected production interruption;
- financing cost when the business case is based on cash payments.
Also decide how depreciation, interest and residual value will be treated. For a simple operating comparison, annual net cash benefit may exclude non-cash depreciation. For formal capital approval, the finance team should use the company’s standard investment model.
A Worked Hypothetical Example
The following numbers are educational only. They are not an AiGRAFT quotation, customer result or equipment-performance statement.
| Item | Hypothetical annual or one-time value |
|---|---|
| Equipment and ancillary items | $210,000 |
| Freight, installation, utilities and training | $30,000 |
| Total installed investment | $240,000 |
| Avoided labor and overtime per year | $96,000 |
| Avoided rework and outsourcing per year | $14,000 |
| Additional capacity benefit | $0 in the base case |
| Additional annual operating cost | $28,000 |
| Annual net benefit | $82,000 |
Simple payback = $240,000 / $82,000 = approximately 2.9 years
Simple annual ROI = $82,000 / $240,000 x 100 = approximately 34.2%
The example deliberately assigns no value to additional capacity. If the nursery later confirms orders that the existing process cannot supply, the contribution margin from those additional units can be added as a separate case.
Test the Result with Sensitivity Analysis
A single answer hides the uncertainty in utilization, labor availability and demand. Build at least three scenarios. Using the same hypothetical $240,000 installed investment and $28,000 annual operating cost:
| Scenario | Annual measurable benefit | Annual net benefit | Simple payback | Simple annual ROI |
|---|---|---|---|---|
| Conservative use | $60,000 | $32,000 | 7.5 years | 13.3% |
| Base case | $110,000 | $82,000 | 2.9 years | 34.2% |
| High-use case | $145,000 | $117,000 | 2.1 years | 48.8% |
The purpose of the table is not to select the most attractive row. It is to identify which assumptions change the decision. If the project only works in the high-use case, management should verify demand and operating hours before purchasing.
Run additional tests for lower first-year utilization, loaded labor cost, seasonal labor availability, changeover time, maintenance variation, production ramp-up, financing cost, exchange-rate exposure and a scenario with no value assigned to additional capacity.
Compare Nursery Automation Stages on the Same Basis
| Production stage | Main measurable baseline | Common hidden constraint | AiGRAFT reference |
|---|---|---|---|
| Precision seeding | Labor per tray, seed use, trays per hour, correction work | Seed and tray changeover, upstream filling and downstream germination handling | Automatic precision seeder |
| Seedling grafting | Labor per graft, grafts per shift, seasonal staffing | Rootstock/scion preparation, operator loading and healing capacity | Seedling grafting robot |
| Selection and replenishment | Inspection labor, correction labor, donor seedlings and corrected trays | Definition of a weak seedling and availability of suitable replacements | Selection and replenishment machine |
| Seedling grading | Labor per batch, grading consistency and downstream handling | Crop-specific grading rules and handling of each grade | Automatic seedling grading machine |
| Transplanting | Labor per tray, acceptable plants per hour and rework | Root-plug quality, source/destination tray compatibility and tray flow | Automatic transplanting machine |
| Connected line | Total labor and output across several stations | The slowest station, buffers, layout and downstream capacity | Integrated production lines |
Questions to Answer Before Approving the Investment
- Which production problem is the equipment expected to remove?
- What is the measured manual cost per acceptable tray or seedling?
- How many days and shifts will the machine actually run each year?
- Which operators remain necessary for feeding, collection, inspection and supervision?
- What tray, seed, crop or seedling changeovers are required?
- Can upstream material supply and downstream handling absorb the planned rate?
- What quality rule will be used in the acceptance trial?
- Which benefits reduce cash spending, and which only reassign labor?
- Is there confirmed demand for additional capacity?
- What maintenance, spare parts and local technical support are required?
- How will exchange rates, import costs and financing affect cash flow?
- What happens to ROI if utilization is lower than planned?
Frequently Asked Questions
What is a reasonable payback period for nursery automation?
There is no universal answer. It depends on the nursery’s capital policy, equipment life, risk, financing cost and alternative uses of cash. Compare the project with the company’s own investment threshold.
Should reassigned workers be counted as labor savings?
Only if the reassignment creates measurable value, such as avoided hiring, reduced overtime, less outsourcing or additional profitable production. If payroll does not change and no other benefit is measured, it is not a direct cash saving.
Should added production capacity be included in ROI?
Include it only when additional saleable demand is credible. Calculate the contribution margin from the extra units, not total sales revenue, and keep uncertain demand in a separate scenario.
Does the fastest machine produce the highest ROI?
Not necessarily. A higher-capacity machine can have poor utilization if the nursery lacks enough trays, uniform seedlings, operators, downstream space or confirmed demand. The machine that fits the production constraint may create a stronger return than the fastest model.
What information should be sent for an automation evaluation?
Send crop and variety, tray specifications, current production steps, operators per shift, loaded labor cost, annual and peak volume, current output, target capacity, facility layout, utility conditions, and photos or videos of the workflow.
Build the ROI Model Around Your Nursery
AiGRAFT develops equipment for precision seeding, grafting, seedling selection and replenishment, grading, transplanting and connected nursery workflows. Review the AiGRAFT nursery automation equipment, then prepare the operating data listed above.
For a useful technical discussion, send the real crop, tray, labor, volume and layout information. AiGRAFT can review the equipment configuration; your finance team can then apply the verified project costs and operating assumptions to the ROI model.